.avif)

SMART INSIGHTS · MEASURE & OPTIMISE CONTENT
See what content actually converts
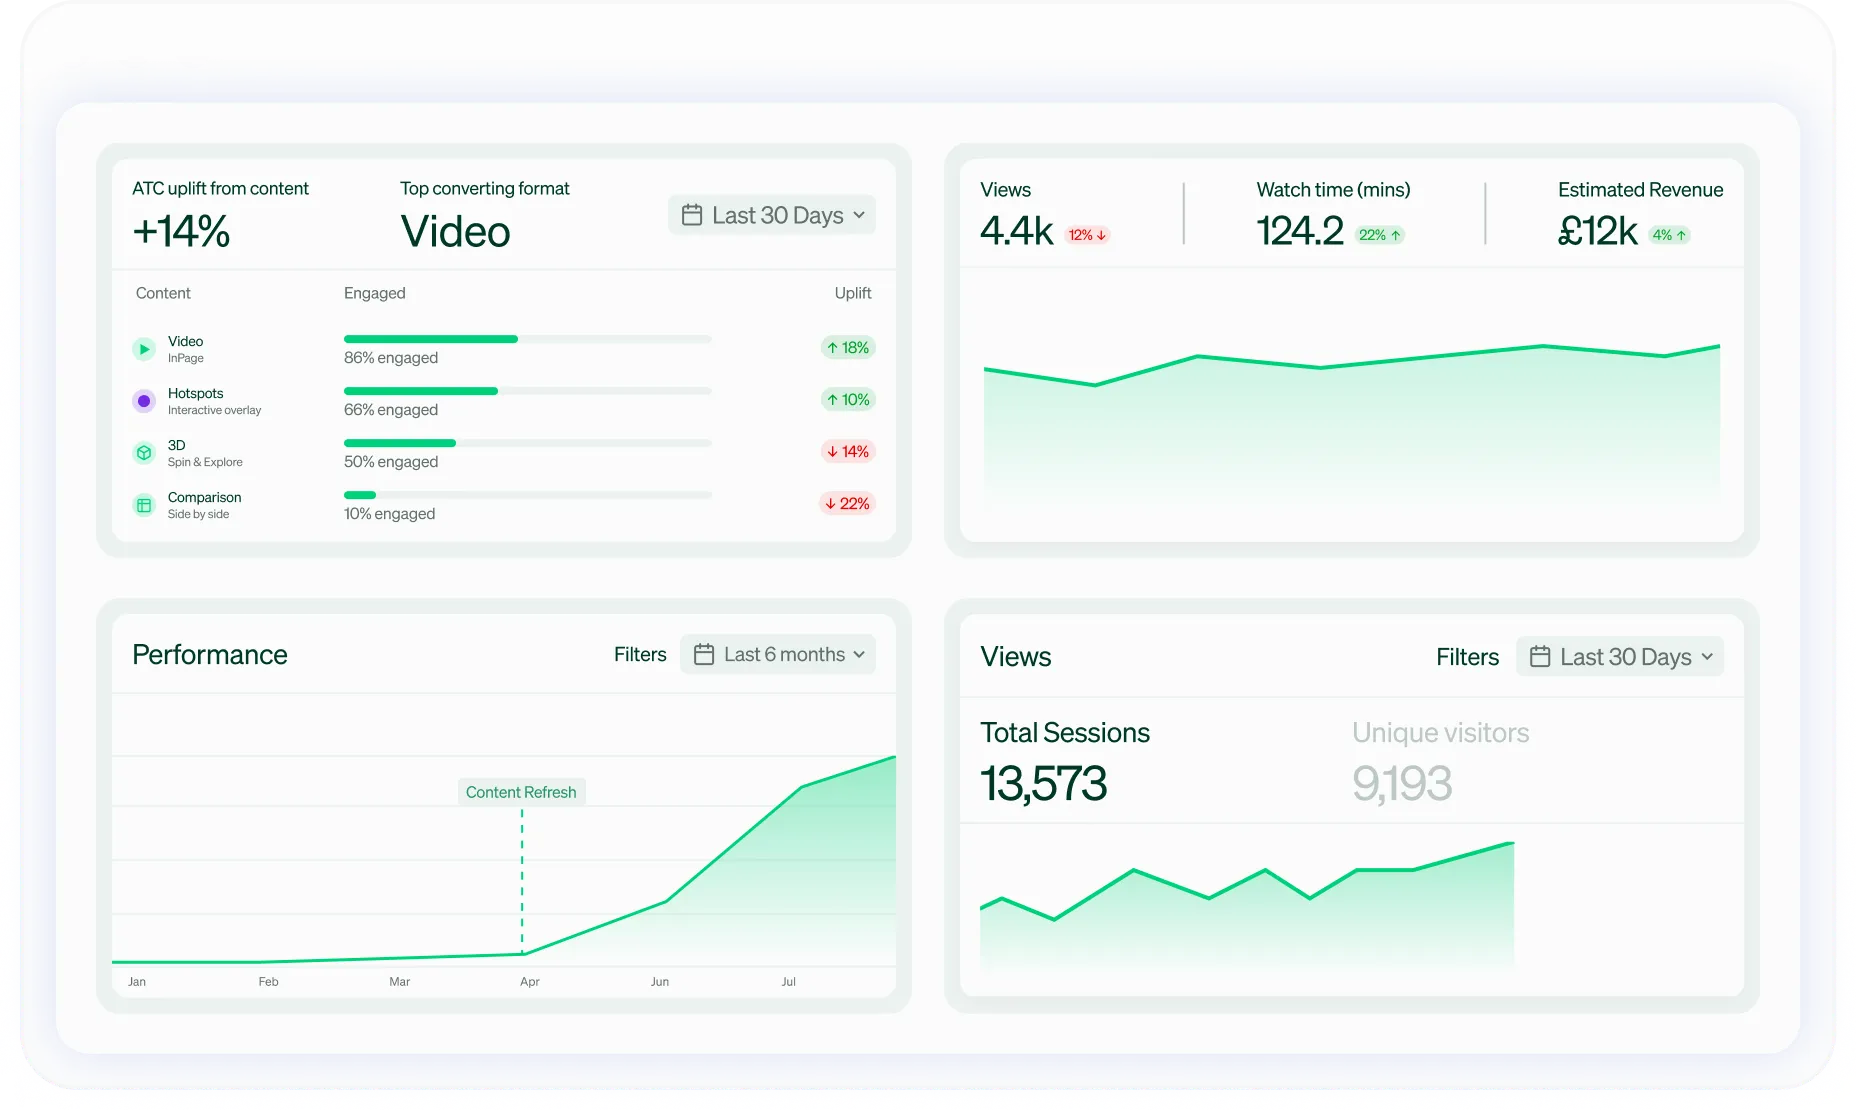
Smart Insights shows you what shoppers viewed, what they engaged with, and how your content performs across the network. Then shows you what to change







































How It Works
Every signal that matters, in one place
Before Smart Insights
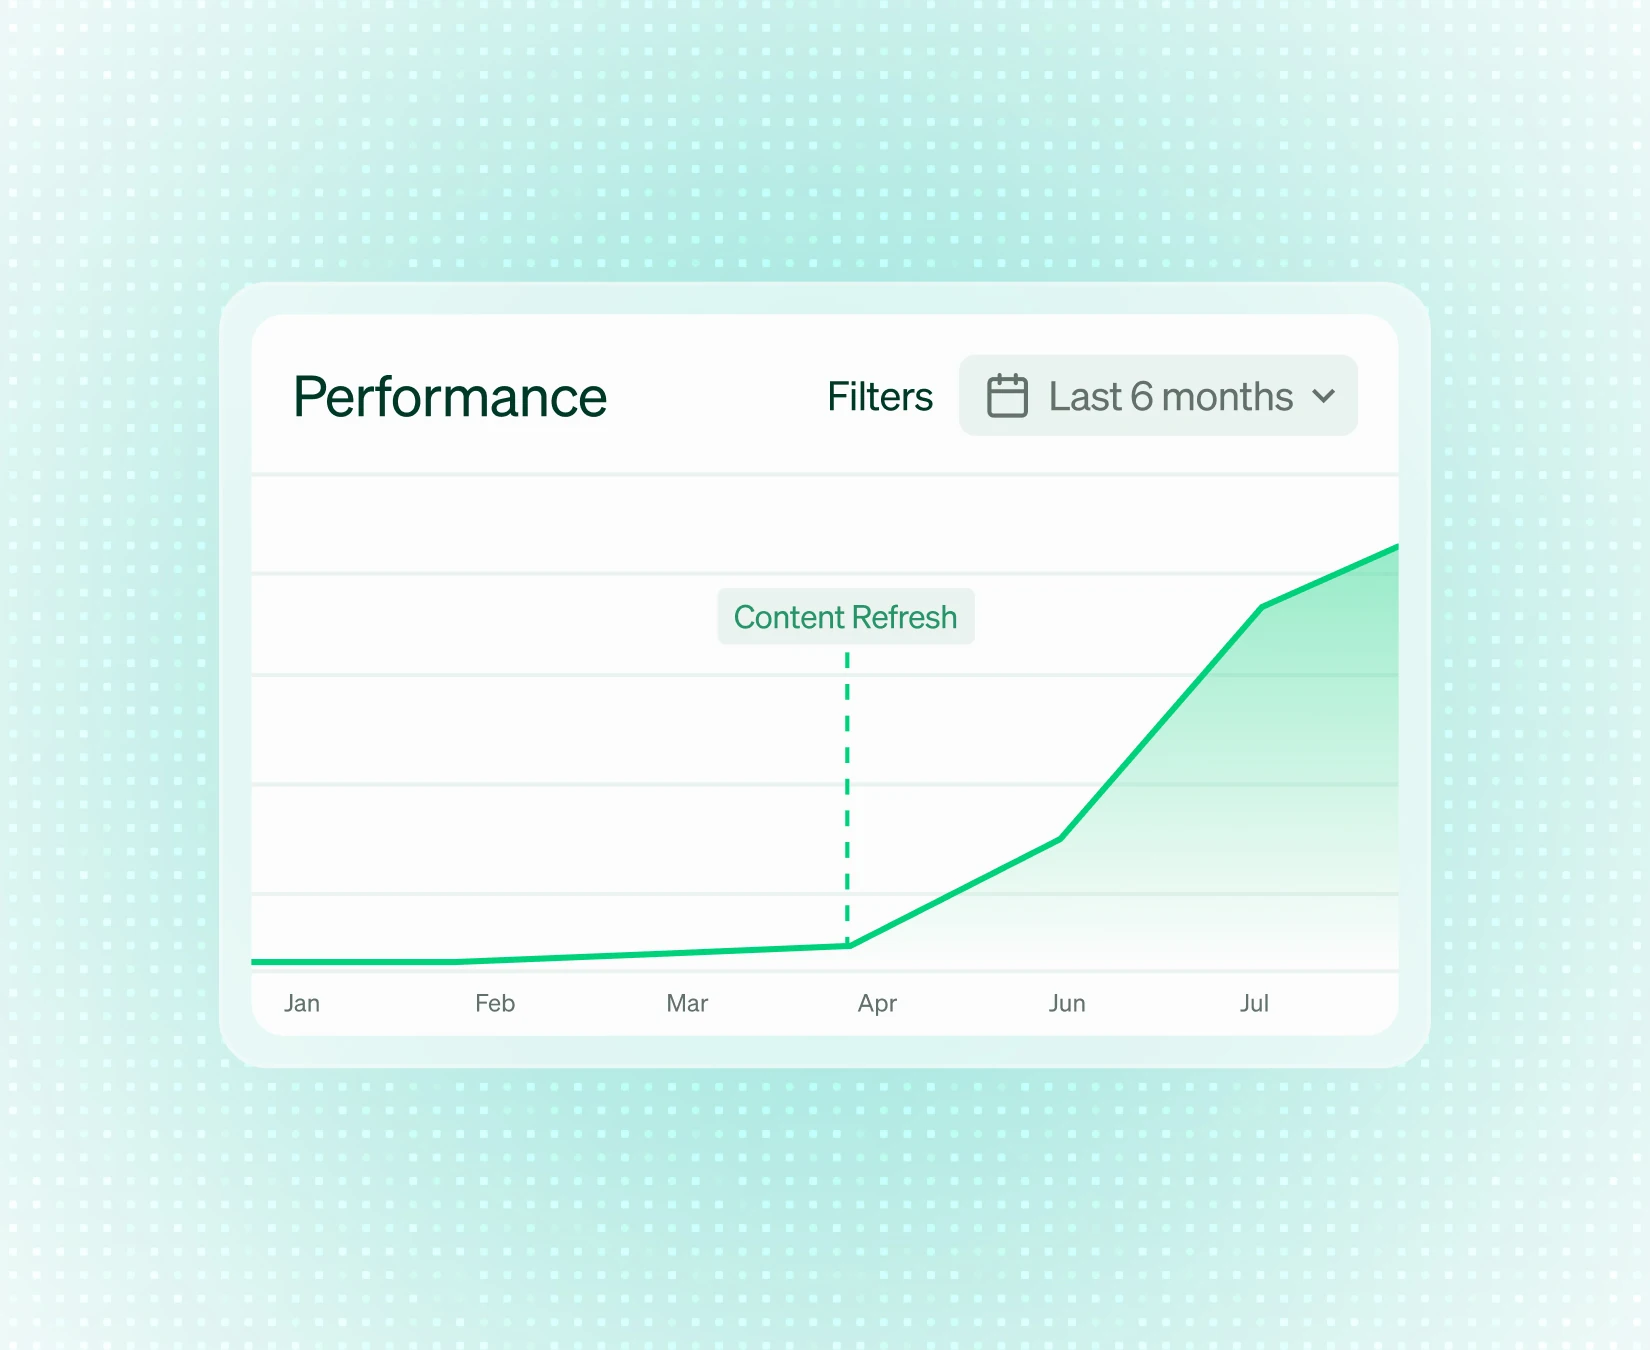
Until now, brands worked blind. You could see that your content loaded on a retailer page, but not whether anyone looked at it. No way to tell which video held attention, which feature got explored, or which content helped make the sale. You spent on content and hoped.
With Smart Insights
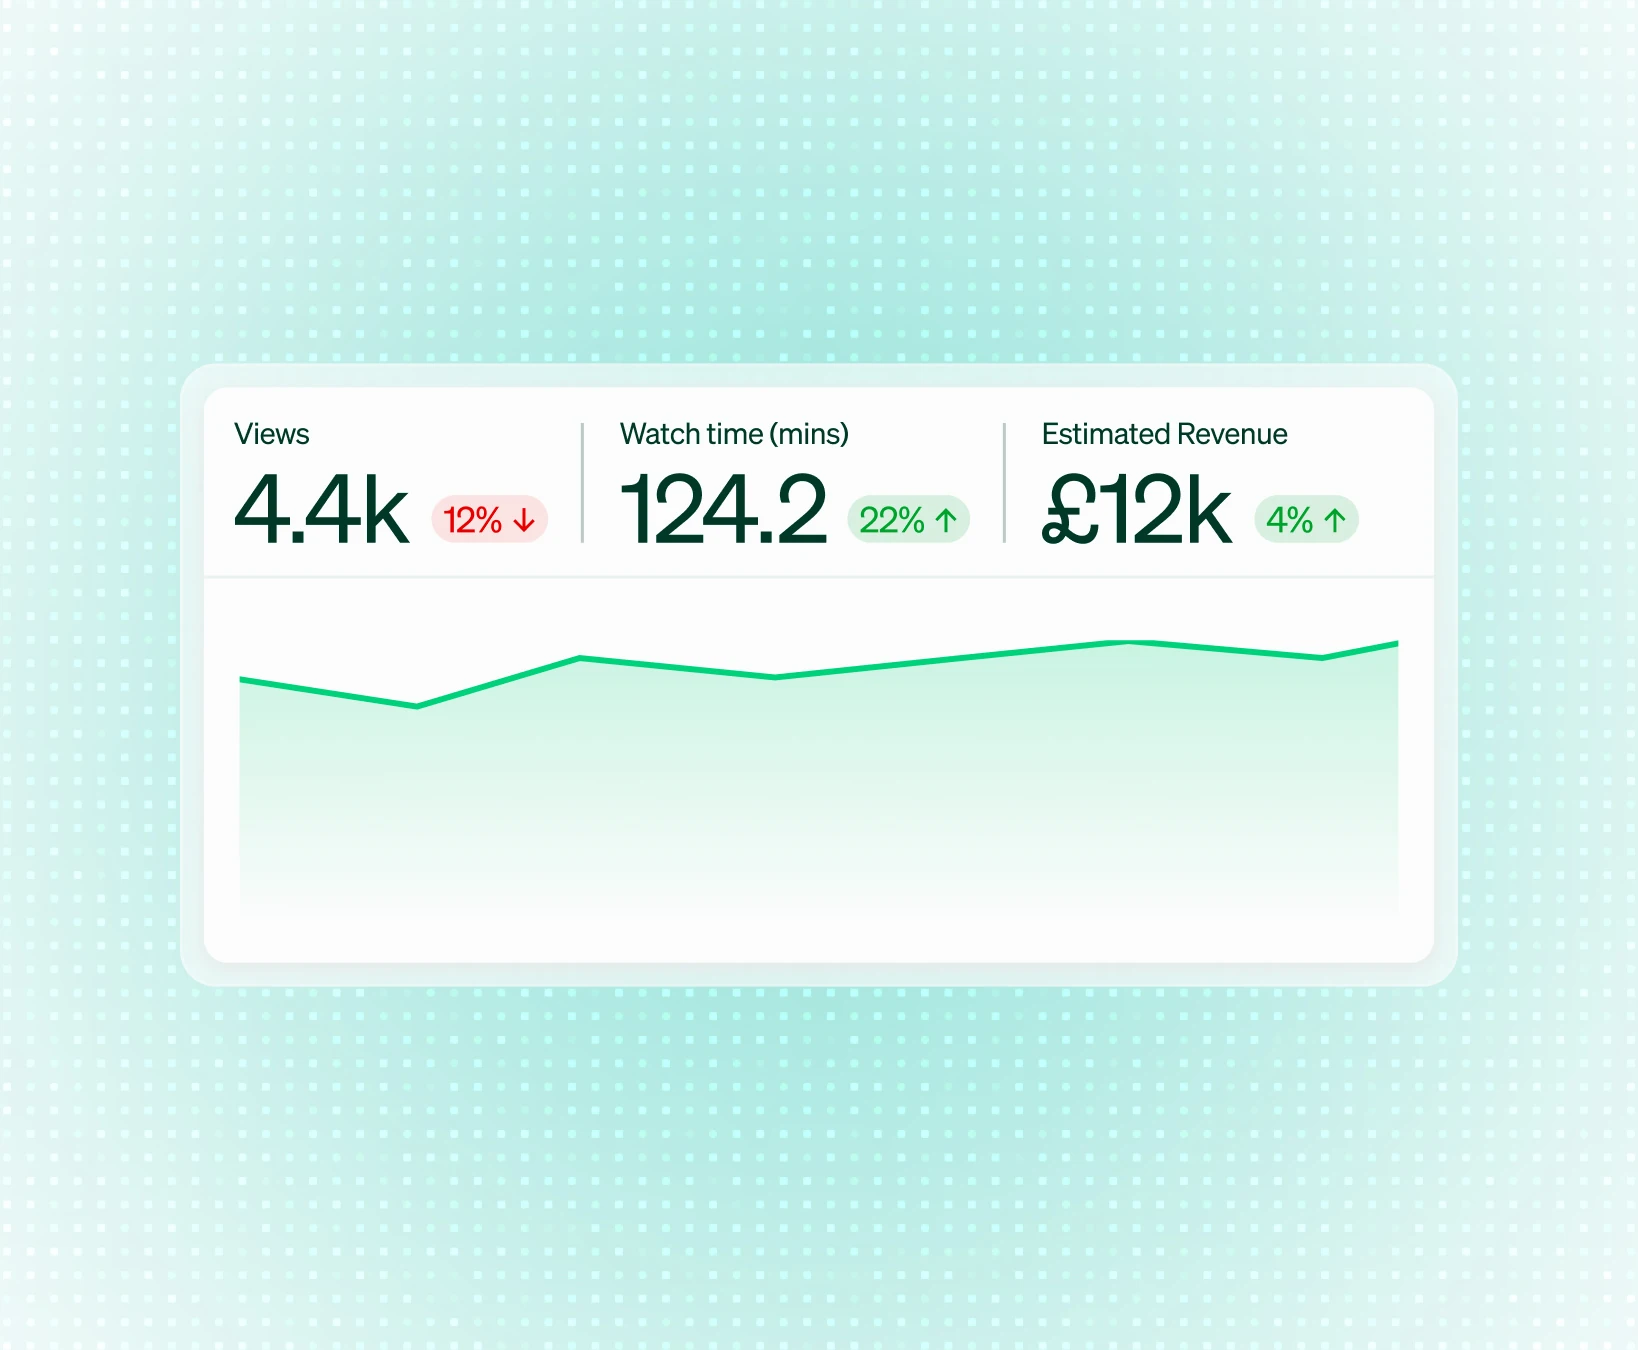
Smart insights changes the question. Not "Did my content load?" but "Did it help the shopper add to cart?" You get real engagement data from the retailer pages where buying happens, across the whole network, so you can see what is working as well as the net return for your programme investment.
What ARE Smart Insights?
Know what content works. Do more of it
Measure your reach
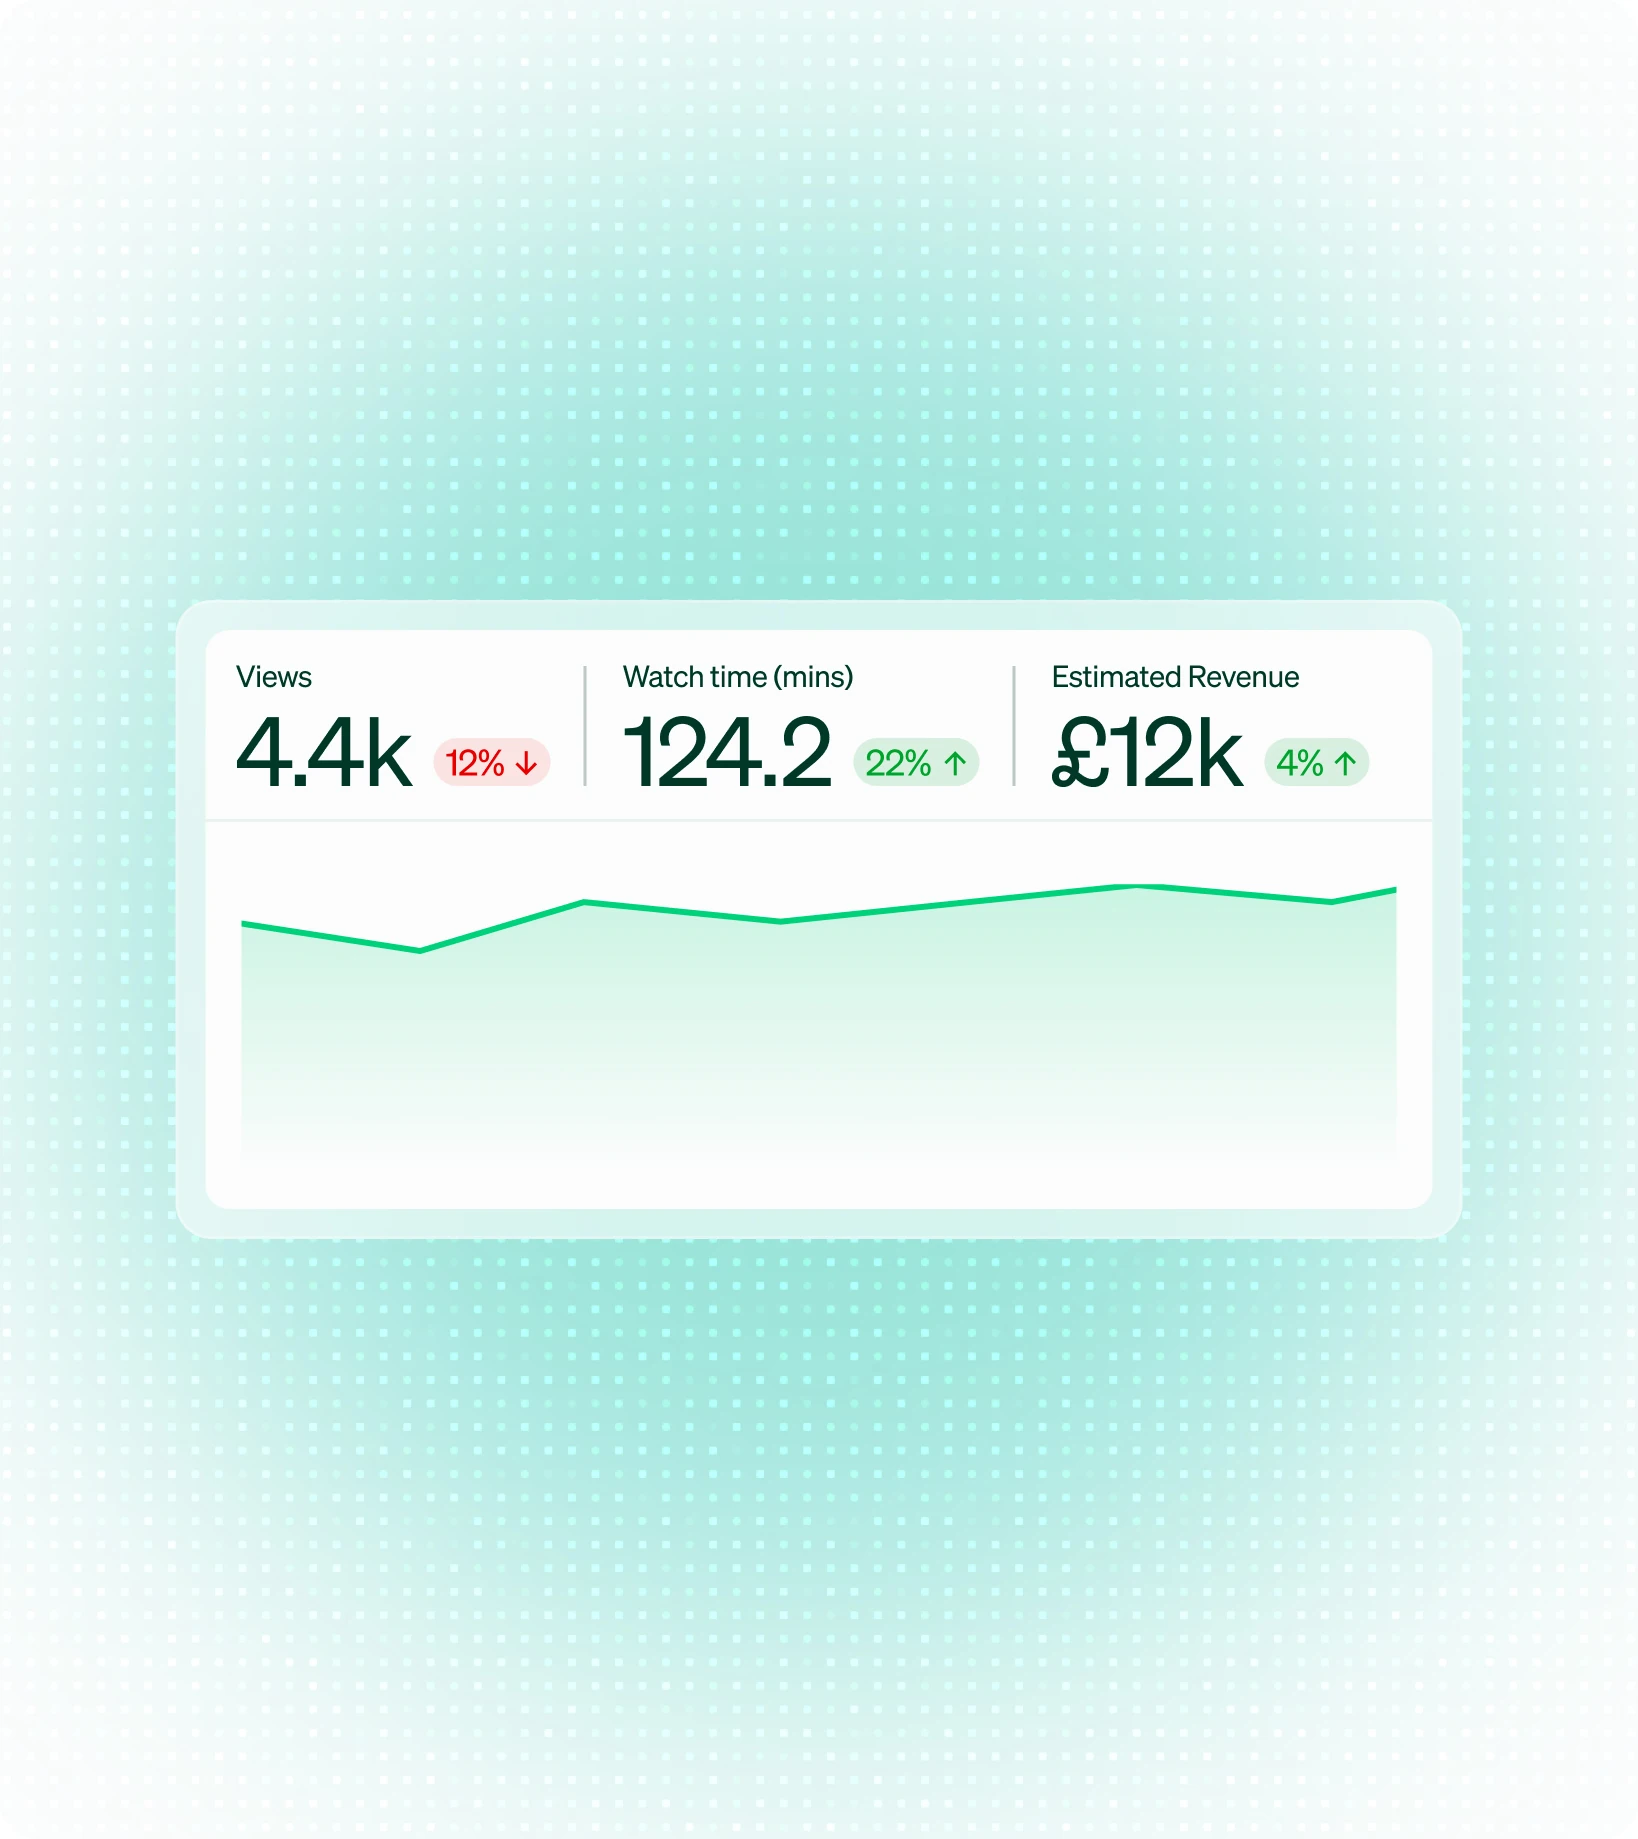
Impressions, engagement, conversion lift, and revenue. Every metric from every touchpoint, centralised in one platform that gives you the full picture of where your content is flowing and the ROI you are generating.
Tracking the content impact
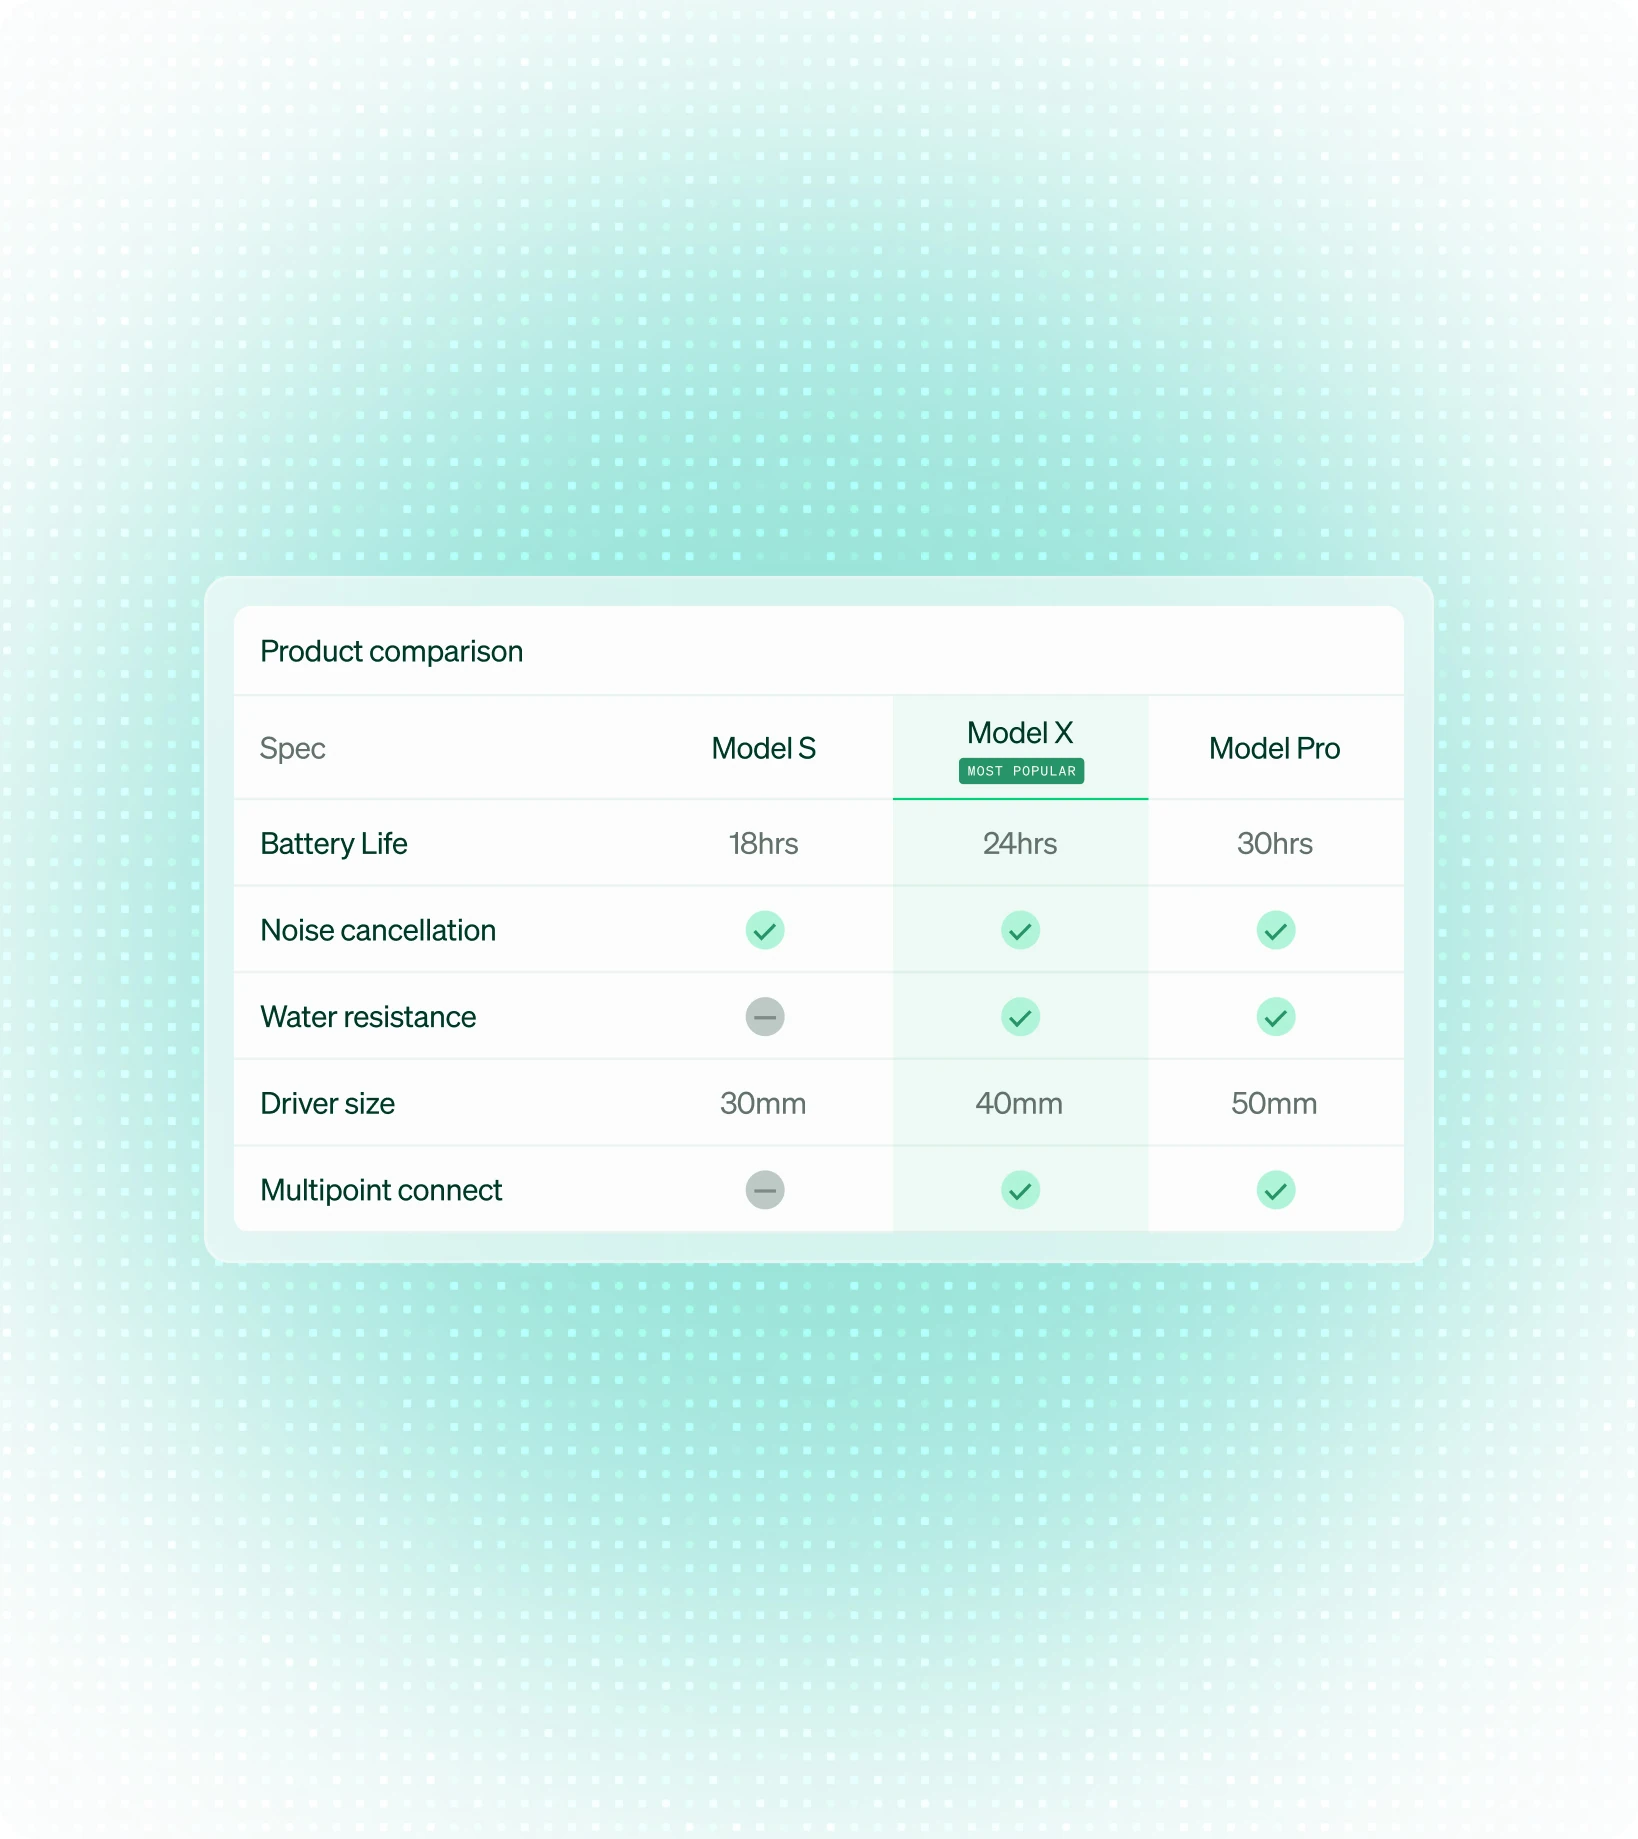
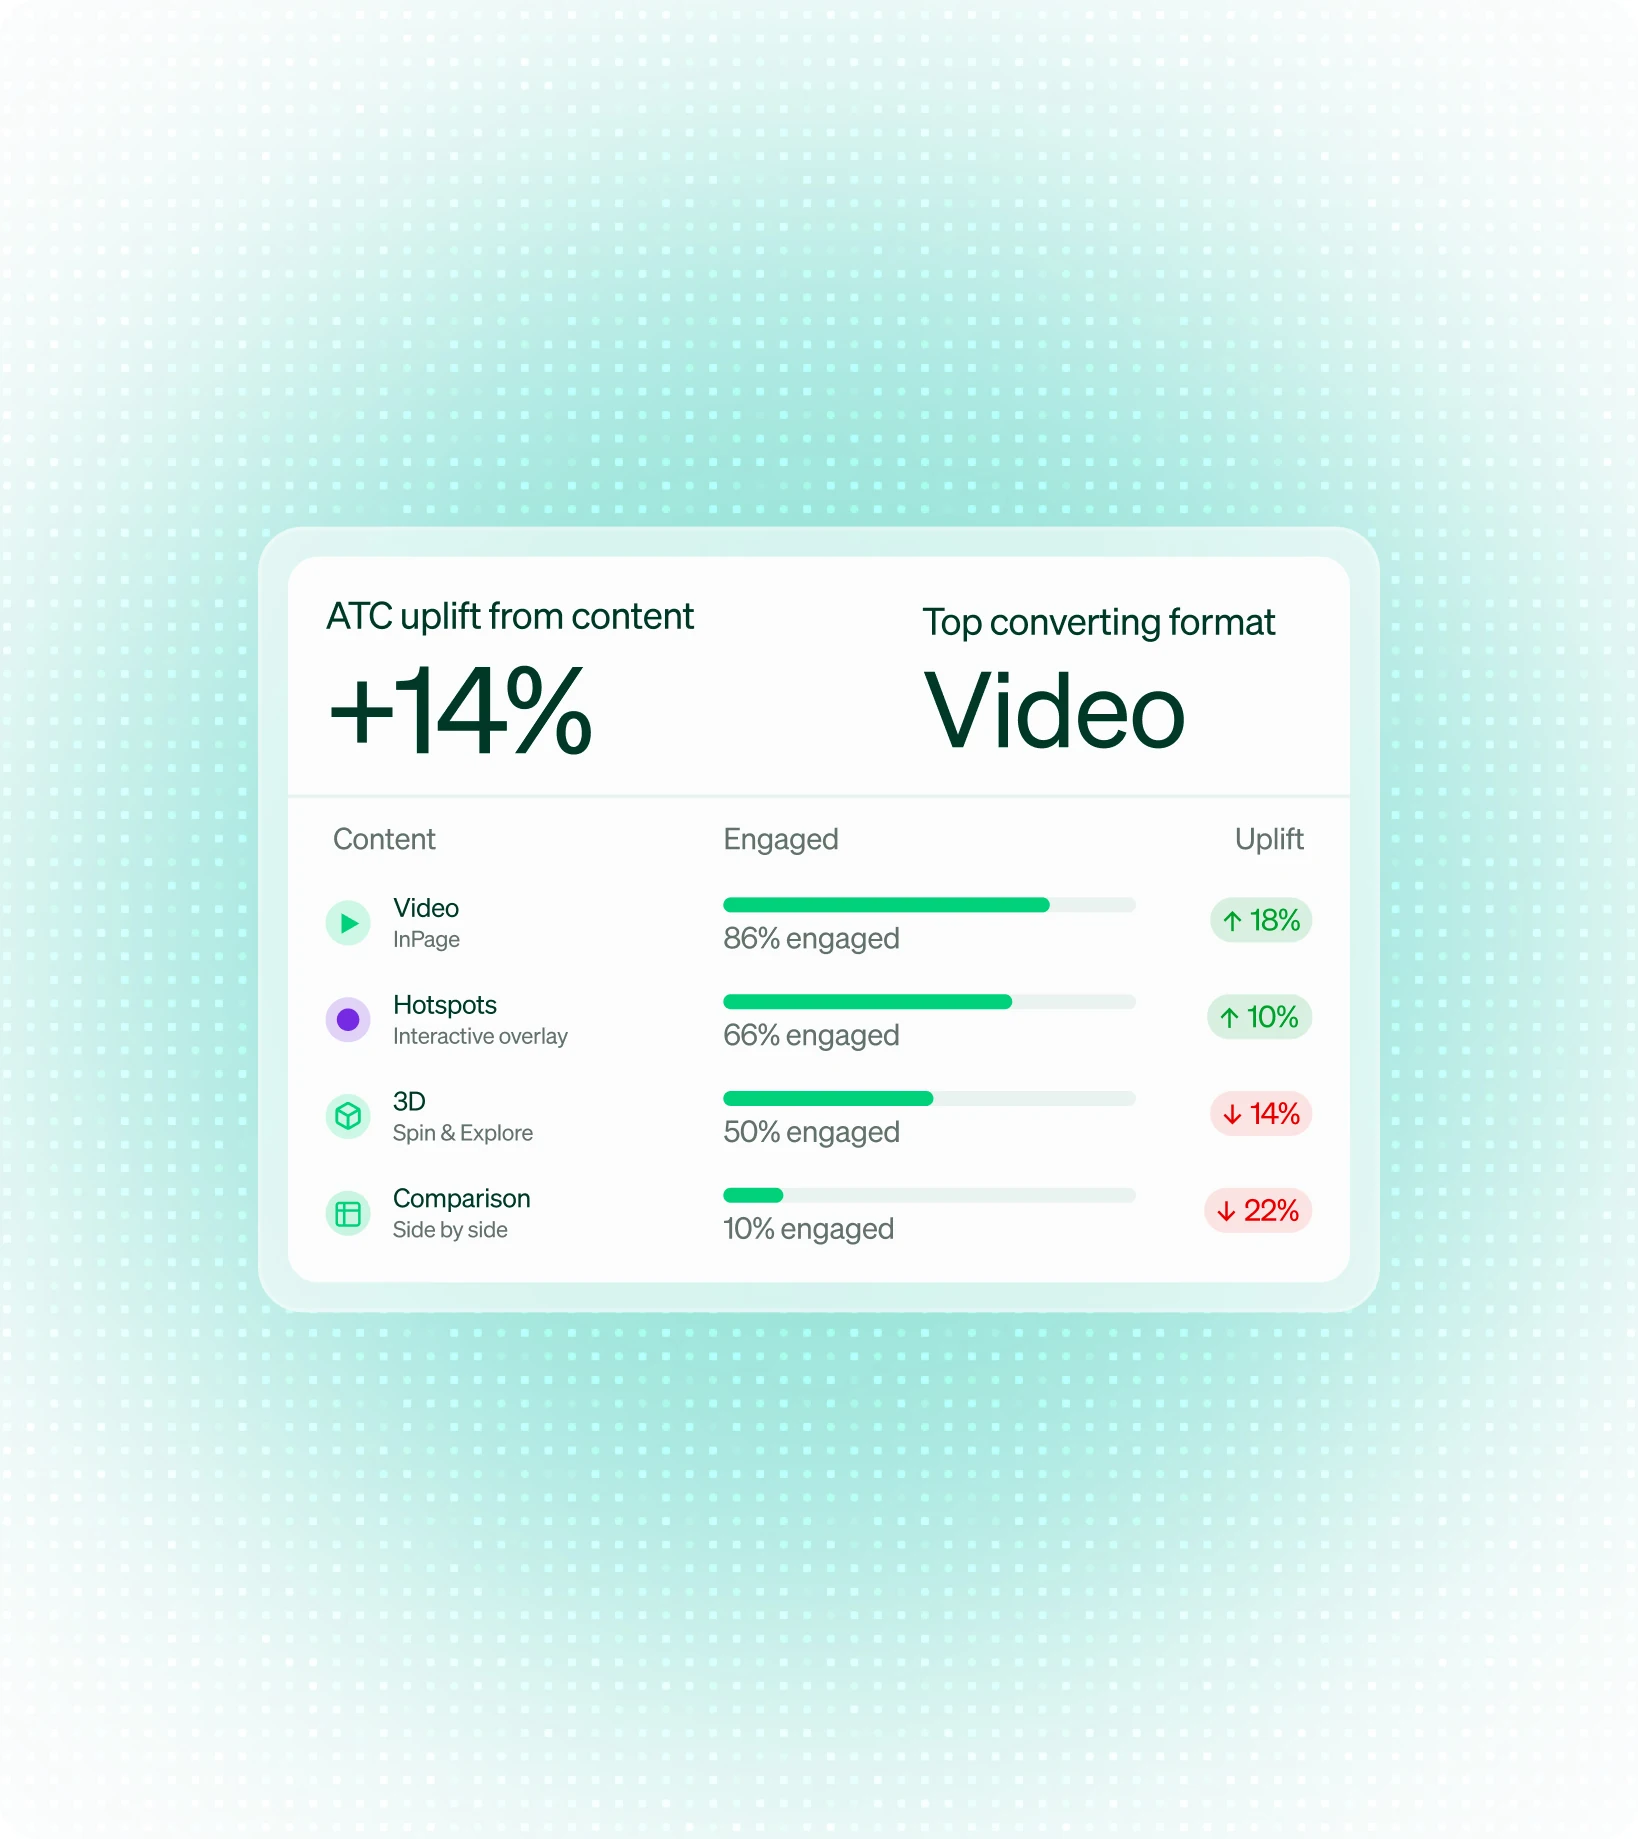
Not just whether your content loaded, but what happened next. Which videos were played, which hotspots were open, which comparisons were read. Real engagement, on the pages where buying happens.
Act on what works
Insights only count if you can act on it. See which content converts, then double down on the winners and cut the dead weight. Pull the data into your own stack or read it all in the dashboard. Either way, every content decision now has evidence behind it.
Sharpen content over time
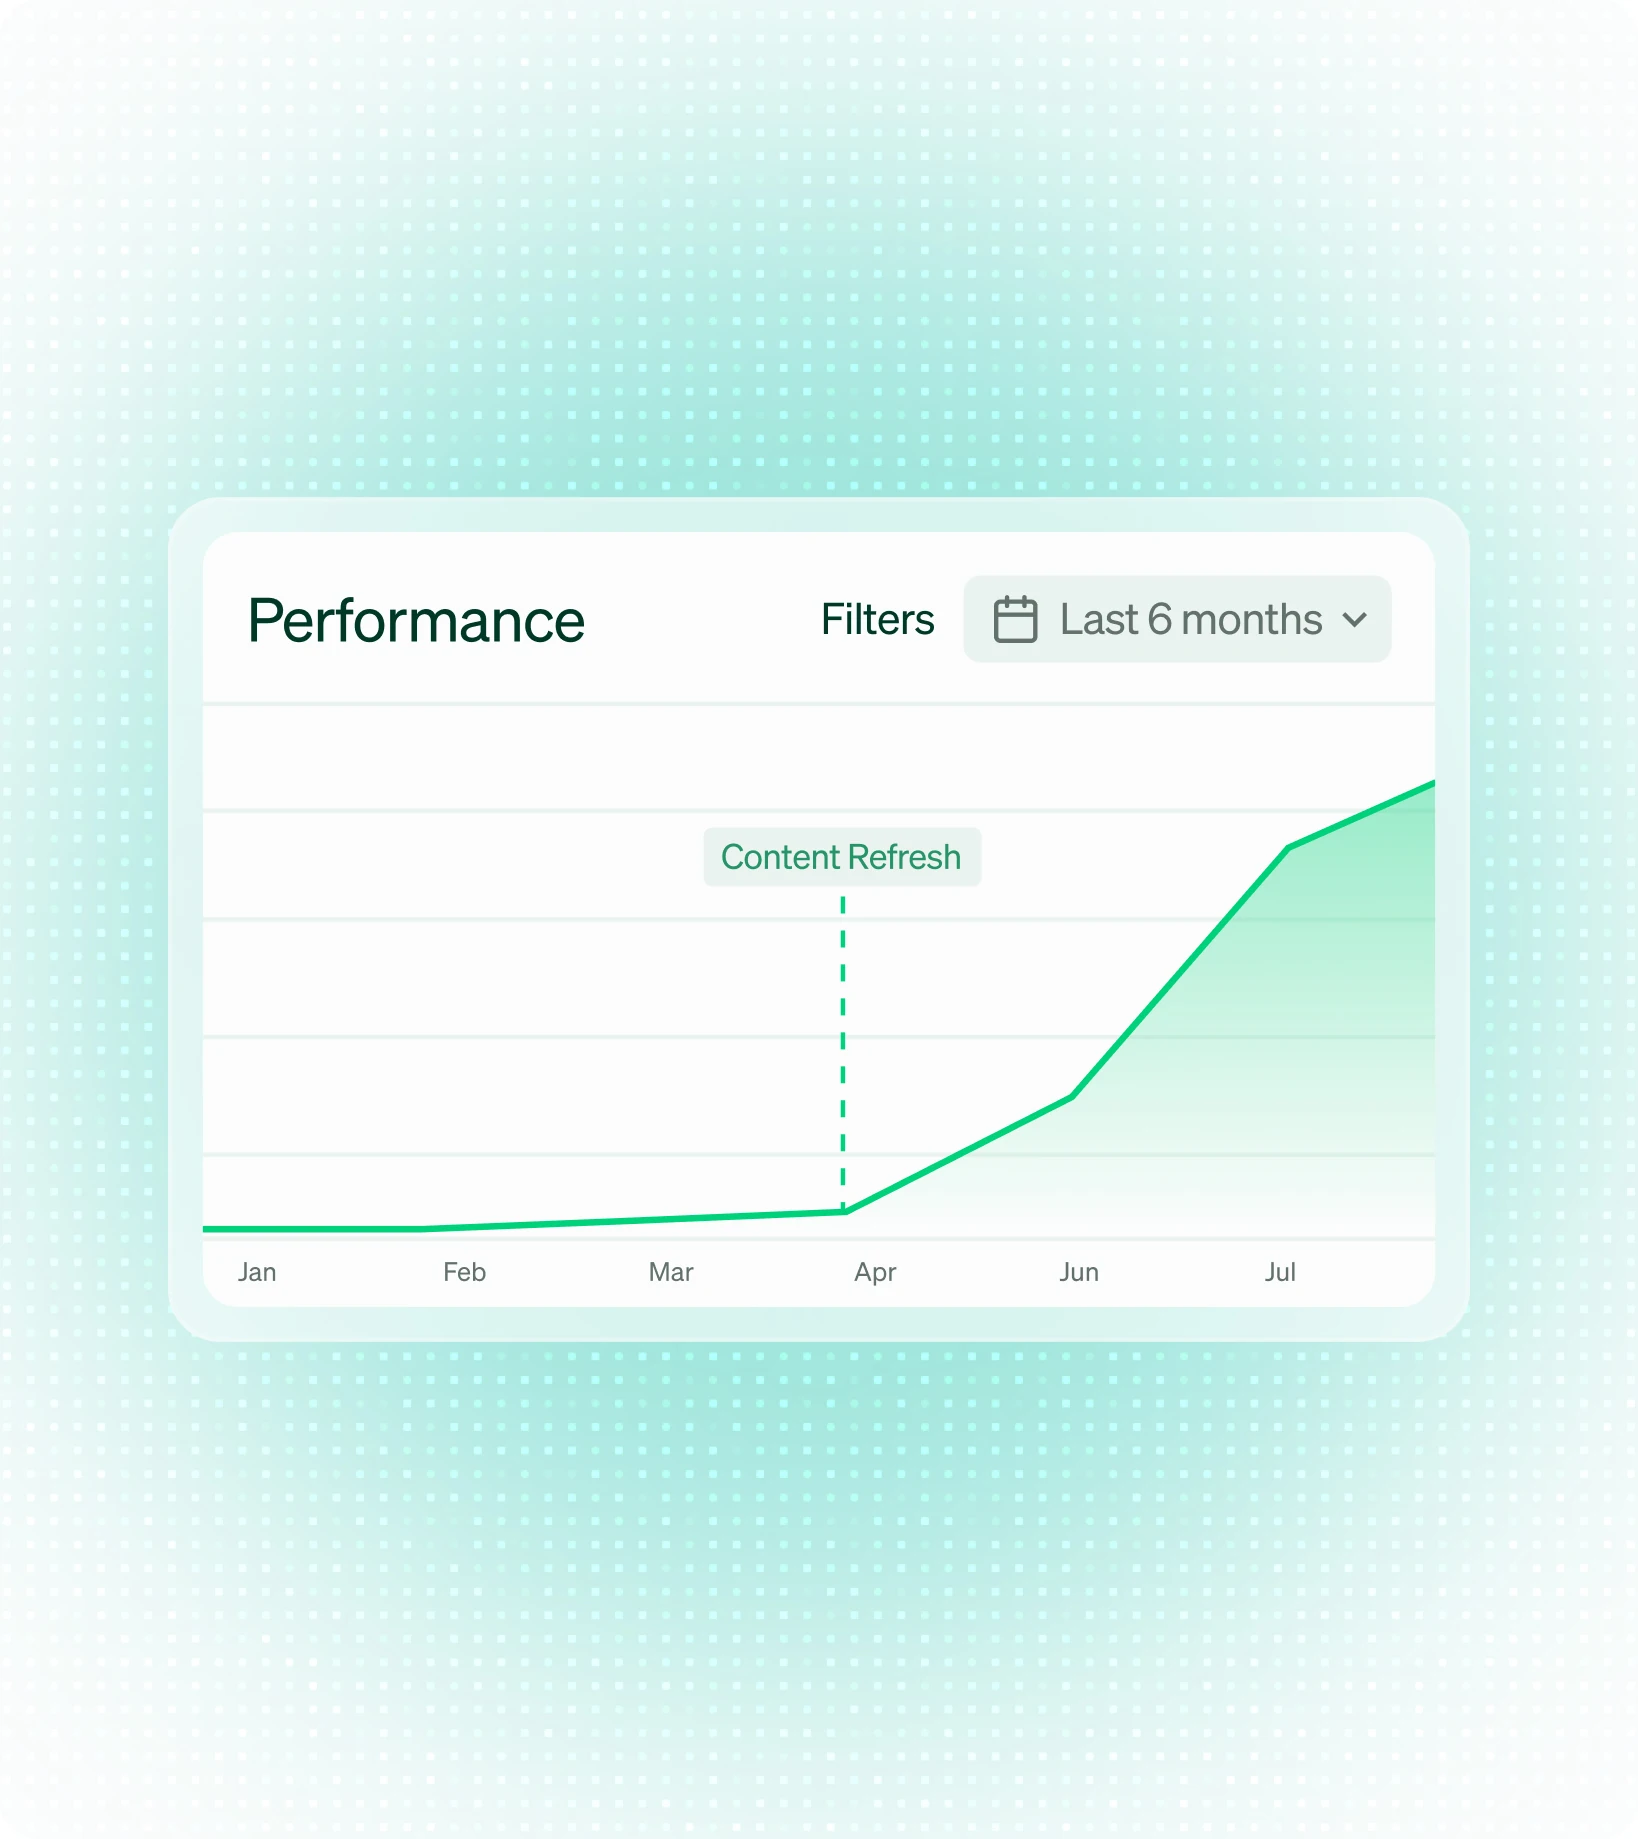
Smart Insights closes the loop. Publish, measure, act, repeat. Every cycle teaches you more about what your shopper responds to, so your content gets sharper and your results compound, season after season.
1B+
Unique shoppers annually
40K
Hits a minute
2.3M
Content signals tracked each day
~1minute
Average page dwell to analyse
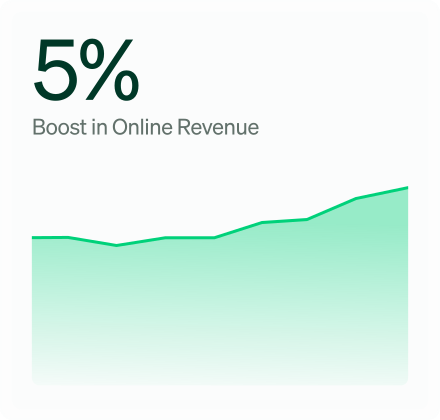
Flixmedia helps John Lewis boost online revenue by 5%
See how John Lewis lifted online revenue by 5% with Flixmedia INpages, plus 3% gains in conversion and average order value.
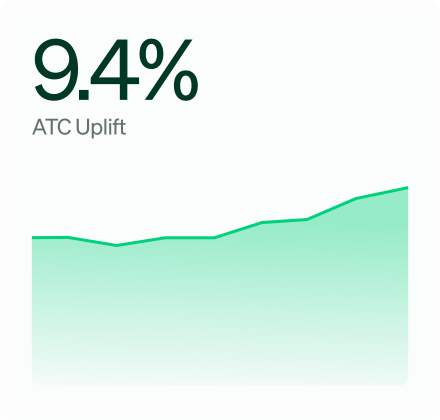
Flixmedia helps India's retailers improve cart conversion by 9.4%
See how Flixmedia rich content lifted cart conversion by 9.4% for India's retailers, tested across 355,794 shoppers at 99% confidence.
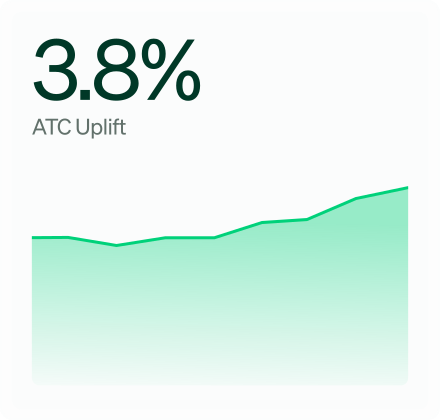
INpages drive a 3.8% ATC uplift across Australian retailers
See how Flixmedia INpages lifted add to cart by 3.8% across leading Australian retailers in a test of 451,152 shoppers. Read the full results.
faqs
Still have questions? We’re here to help.
Google Cloud Console, GBQ Client Libraries, and GBQ API.
Main Dashboard, Product URL, Daily Unique Visitor, Hotspots, Traffic Trend, Devices & Browsers, Video, Reviews, Flix AR, Comparison Tables, Shop in Shops, and Widgets (where purchased).
An API providing access to Measure Effect data via Google Analytics Hub to implement Flixmedia datasets into the client’s BI platforms.
Unlock the data behind your content
Track engagement, comment, measure performance, and optimise your rich media across the entire Flixmedia network in one place.